Learn how Copilot and data visualization can transform SharePoint list data into useful insights, clearer patterns, and better business decisions.

Across Microsoft 365, teams already use SharePoint lists to track projects, requests, policies, risks, assets, events, onboarding, and countless other business processes. Every item added, assigned, updated, approved, or completed creates a signal. Together, those signals can tell us where work is slowing down, which problems keep returning, and where attention is needed.
The challenge is that we often experience this data one row at a time.
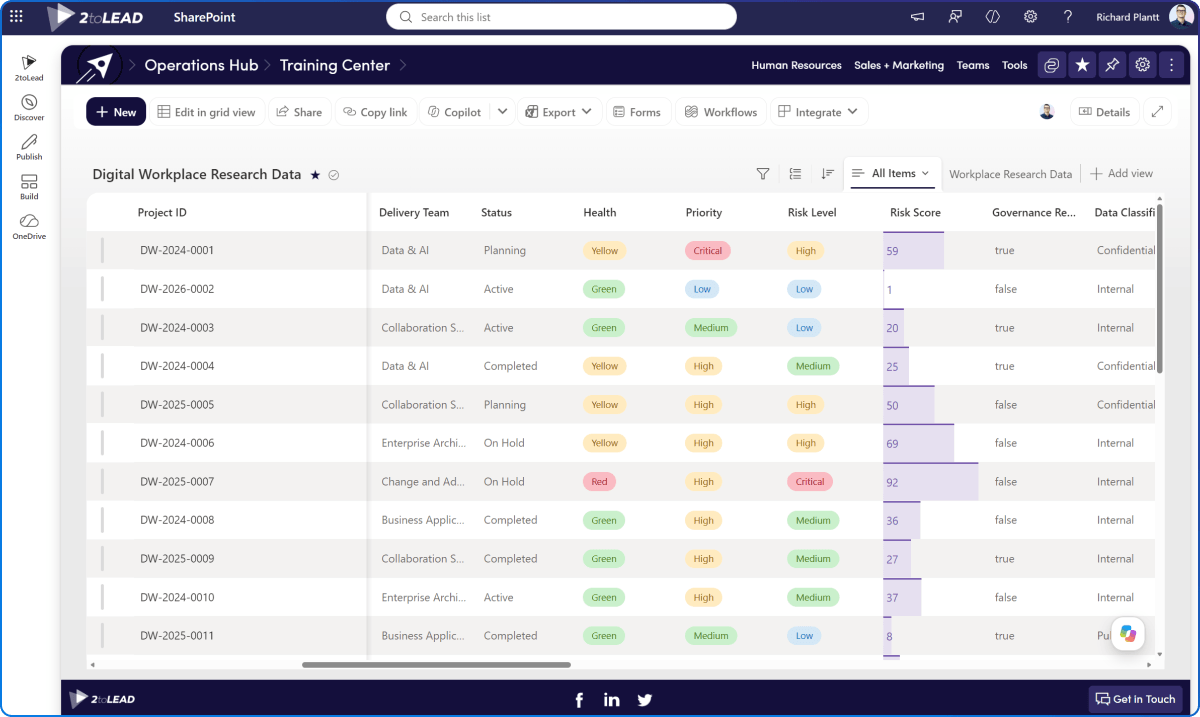
A SharePoint list is usually created to support a process. Someone submits a request. A project manager updates a milestone. A policy owner changes a review date. A team member records a new risk.
At that level, the list helps people manage individual records. But collectively, those records tell a larger story.
A project list can reveal which types of projects are most likely to fall behind. A service-request list can show how demand is changing and where resolution times are increasing. A policy register can expose a broader governance risk caused by overdue reviews, missing owners, or approval backlogs.
The value is already there. We need better ways to see it.
SharePoint provides several ways to organize and present list data. We can create views, sort and filter records, group related items, use gallery layouts, and apply formatting to highlight information that needs attention.
These tools help people scan a list and identify important records. The next opportunity is to step back and explore what the collection of data is telling us.
A line chart could show whether service requests are increasing. A timeline could expose approaching milestones or review dates. A heat map could highlight concentrations of risk. A relationship diagram could reveal dependencies between projects, systems, owners, or business areas.
The goal is not to create more charts. It is to help someone notice something they might otherwise miss.
“Show projects by status” gives us a chart.
“Show which projects are most likely to miss their next milestone, and what they have in common” gives us a question worth exploring.
How we present this information matters too. In our article, SharePoint HTML Pages: A New Way to Think About Your Intranet?, we explored how new SharePoint experiences can help employees understand information and identify their next step. The same principle applies to list data: start with what someone needs to understand, not simply what the technology can display.
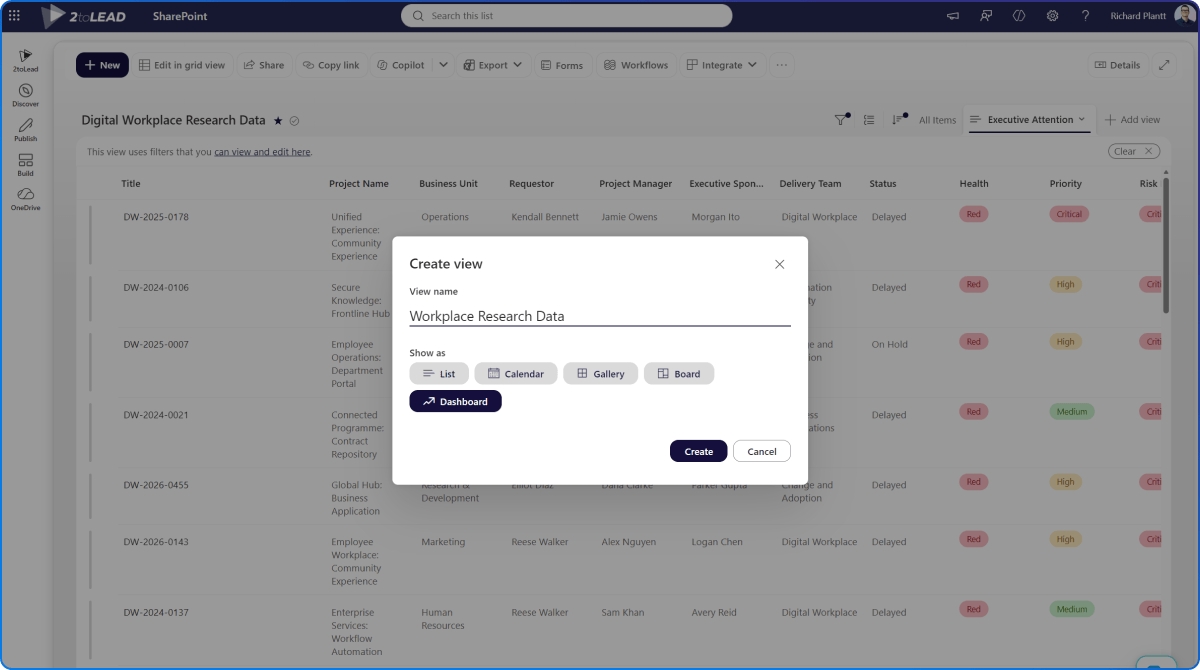
Creating custom data visualizations has traditionally required knowledge of JavaScript, APIs, data structures, and front-end development.
Copilot lets us begin with the question instead.
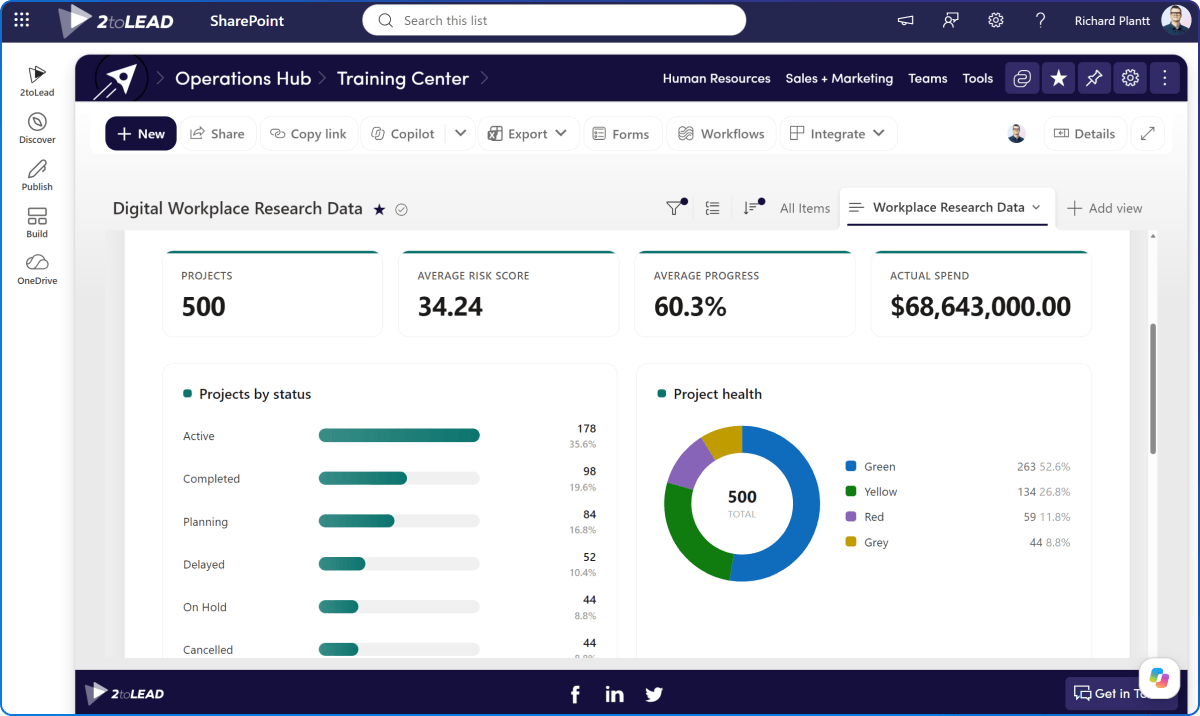
Show how service requests have changed over the past 12 months. Group them by type and highlight categories where average resolution time is increasing.
Show which policies are overdue, due within 60 days, waiting for approval, or missing an owner. Break the results down by department. These prompts describe what someone needs to understand, rather than the technology required to build it. This is where Microsoft’s continued investment in Copilot and SharePoint becomes significant.
At Microsoft Ignite 2026, Microsoft announced that Copilot and agents can use more than 60 SharePoint operations across lists, libraries, approvals, rules, files, folders, and other capabilities.
Microsoft reported that adding these SharePoint tools increased Work IQ’s task pass rate in its internal evaluations from 70.1% to 84.6%, while using 16% fewer tokens.
Those numbers point to something bigger. When Copilot can understand the structure and operations behind our information, it can work more effectively with that information.
SharePoint lists are not simply places to store records. Their structured data can become part of the context that Copilot and agents use to understand work and help people act.
AI does not reduce the importance of thoughtfully structured data. It makes that structure more valuable.
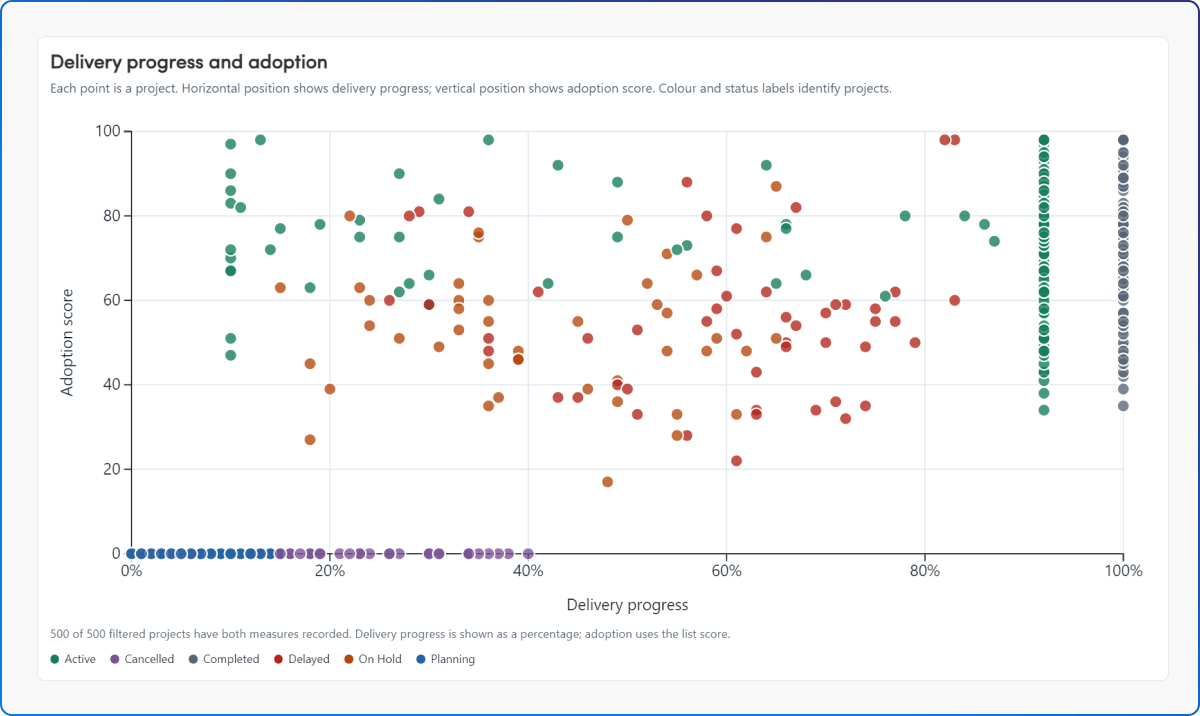
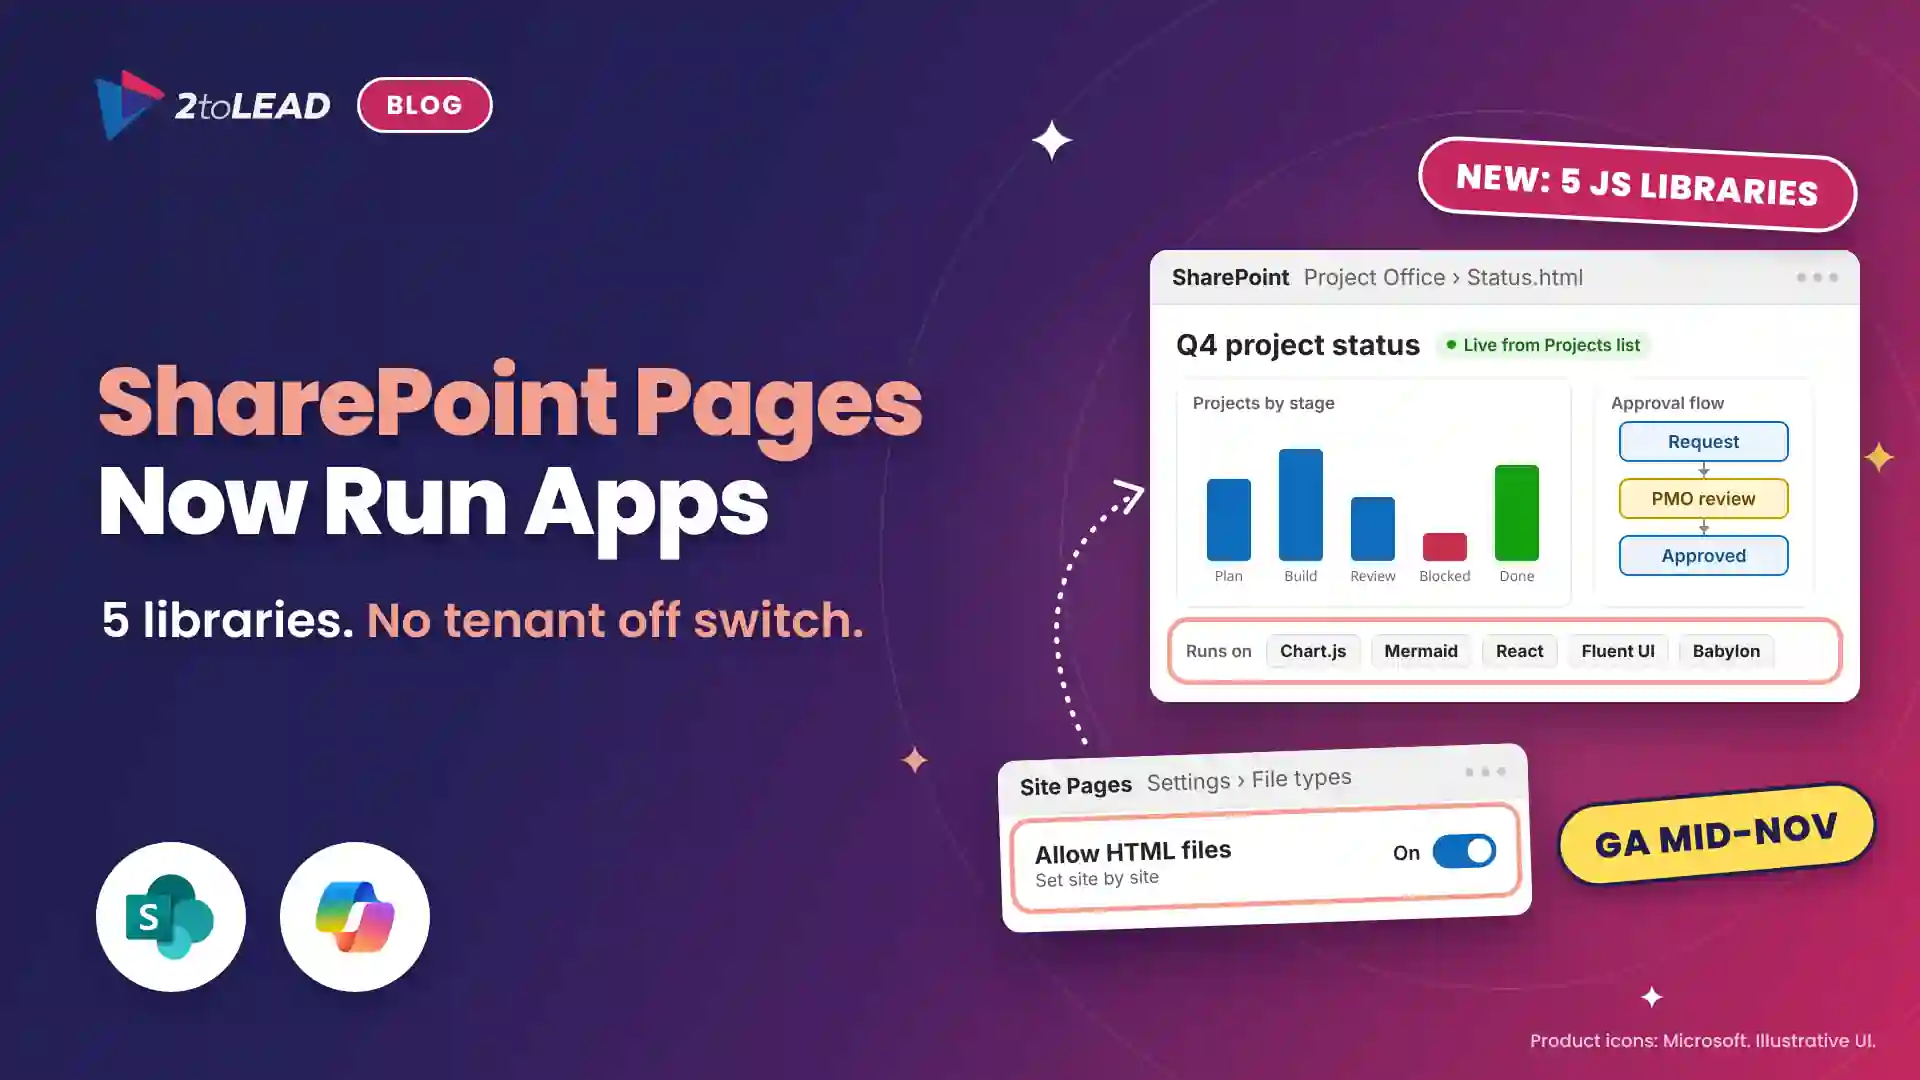
The prospect of richer visualization libraries, potentially including D3.js, makes this direction even more interesting.
D3.js can support highly customized, data-driven visualizations that go beyond common chart types. It could help represent relationships, dependencies, movement, and patterns that do not fit neatly into a standard bar or line chart.
But the larger opportunity is already clear. Copilot is shortening the distance between a business question and a working way to explore the data behind it.
Instead of beginning with “Which chart can we build?” we can begin with “What do we need to understand?”
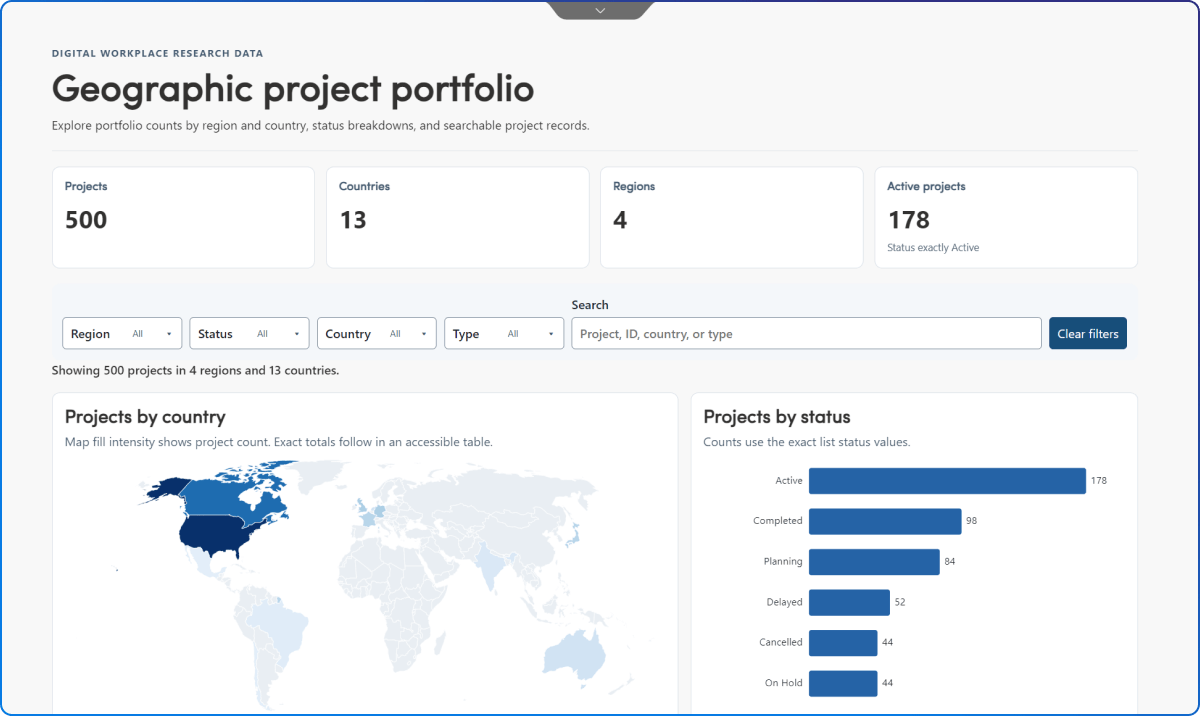
If statuses are inconsistent, categories overlap, dates are missing, or owners are entered as free text, the result may look polished while presenting an unreliable picture.
Better insight starts with better list design:
Copilot can help us explore the data, but it cannot make unreliable data trustworthy.
As visualization becomes easier, we may be tempted to turn every SharePoint list into a dashboard.
That should not be the goal.
Instead, start with four questions:
“Show requests by status” gives us a chart.
“Help a service manager identify where work is accumulating and why” gives us a purpose.
That purpose should determine which data is included, how it is visualized, and what level of detail someone needs.
SharePoint lists have quietly become an operational data layer for many organizations.
They capture requests, decisions, ownership, progress, risk, and completed work. Yet much of their value remains hidden because we continue to experience the data one item at a time.
Copilot and richer visualization options give us an opportunity to look at that information differently.
Structured list data is only one part of the opportunity. In The New Role of the Knowledge Base in SharePoint, we explored how SharePoint can help people, Copilot, and agents move from finding content to understanding its context. Lists add another important layer by capturing the structured signals behind the work, including status, ownership, dates, decisions, and risk.
The goal is not to turn every list into a dashboard. It is to recognize when the records we already maintain can help someone see a pattern, understand a problem, or make a better decision.
Our next useful source of business insight may not require a new data platform or another data-collection project. It may already be sitting in a SharePoint list.
A sprawling intranet where nobody finds anything? Three ways we help:
Atrium Hospitality moved 7,000+ employees into one SharePoint intranet, with 40% faster document search.
Read the case study →


Join Our Newsletter