Microsoft quietly dropped something significant in Fabric's operations and metrics surface: a new Anomaly Detector capability that transforms how administrators monitor capacity and workload behavior. This isn't just another dashboard update; it's a fundamental shift from reactive troubleshooting to proactive intelligence.
For too long, Fabric administrators have operated in a perpetual state of reaction. A user complains about slow queries. A pipeline fails unexpectedly. Throttling kicks in during a critical business hour. By the time you're aware of the problem, the damage is already done.
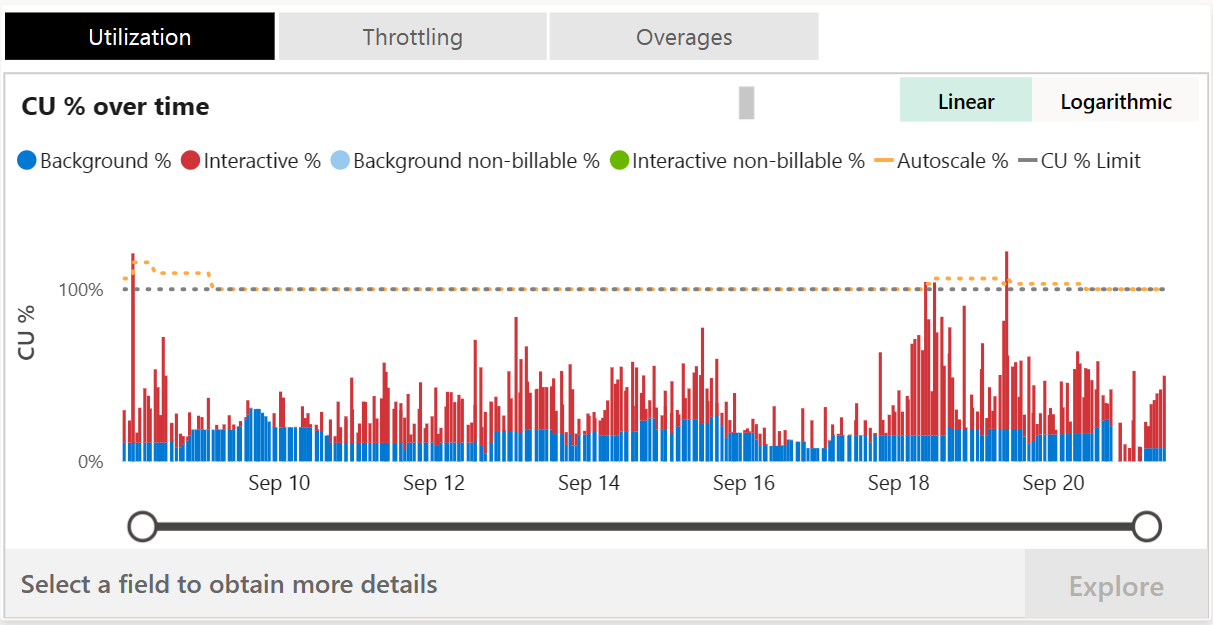
This guide is intended for Microsoft Fabric capacity administrators who want to monitor and optimize their capacity usage proactively, for example, after receiving alerts that their capacity utilization is high. By identifying the items that consume the most capacity units (CUs) on a capacity, administrators can take steps to fine-tune those items or manage usage before performance issues or throttling occur.Troubleshooting guide - Monitor and identify capacity usage - Microsoft ...
The challenge? Traditional monitoring shows you what happened, not what's anomalous. Throttling occurs when operations consume more compute units seconds (CUs) than the capacity SKU allows. Too much throttling can result in a degraded end-user experience. You're left sifting through metrics trying to determine whether a spike is normal business activity or a warning sign of something problematic. Understand your Fabric capacity throttling - Microsoft Fabric
Anomaly detection helps users uncover 'unknown unknowns' in their data. Whether it's spotting irregularities in sensor data or identifying operational bottlenecks, anomaly detection uses industry-standard algorithms to recommend the best models for your data.AI–Powered Real-Time Intelligence with Anomaly Detection (Preview ...
This is precisely what the new Anomaly Detector addresses. Instead of simply reporting usage metrics, Fabric now tells you when something looks wrong.
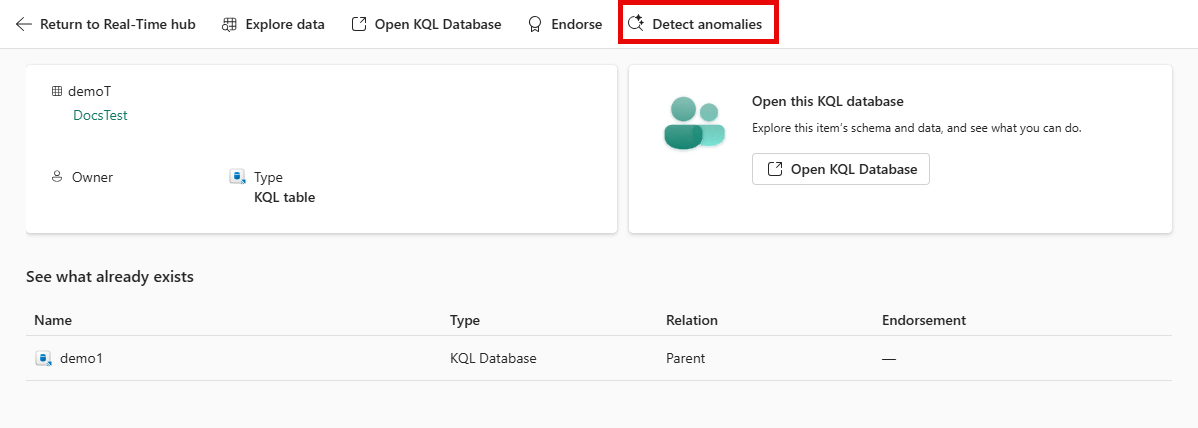
The Anomaly Detector isn't just a threshold-based alerting system; it's an intelligent capability built into Fabric's Real-Time Intelligence stack. Anomaly Detector in Microsoft Fabric Real-Time Intelligence automatically identifies unusual patterns in your data from Eventhouse tables. It empowers you to monitor anomalies in real-time, without requiring data science expertise, by using no-code tools for setup and continuous monitoring.
The key capabilities are substantial:
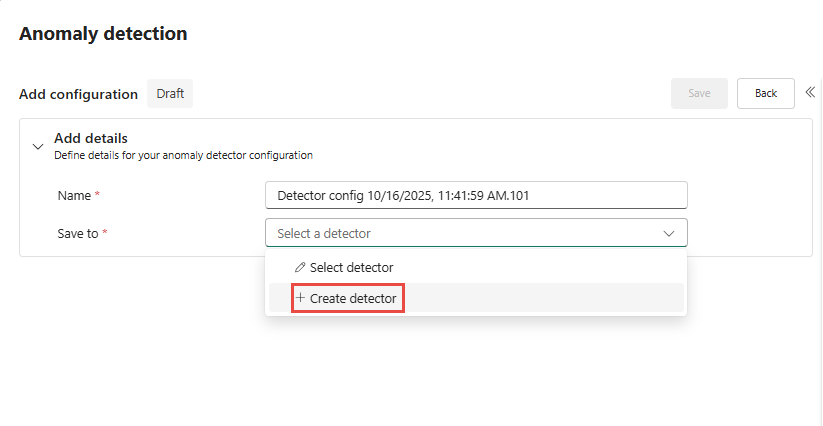
Key capabilities include Model recommendations that suggest the best algorithms and parameters for your data. Interactive anomaly exploration to visualize detected anomalies and adjust model sensitivity. Continuous monitoring to set up real-time anomaly detection with automated notifications. Reanalysis with new data to update your models as new data arrives to improve accuracy.
It democratizes complex data science tasks, making them accessible to less technical personas and enabling organizations to act on insights faster.
What makes this particularly valuable for Fabric admins is how it integrates with the existing capacity monitoring infrastructure. The Microsoft Fabric Capacity Metrics app receives usage events, so capacity admins can monitor Anomaly Detector CU consumption. Customers can view CU consumption per operation, helping them understand costs associated with anomaly detection activities.
Anomaly Detector operations include Interactive Analysis and Continuous Monitoring. When you initiate anomaly detection from the Real-Time hub or Eventhouse table, the system runs queries to analyze historical data and recommend models. Each analysis session consumes CUs based on query complexity and data size. After deploying a model for monitoring, the system routinely queries Eventhouse to detect anomalies in the incoming data.
Here's where this becomes truly powerful for data engineers and Fabric administrators. The Anomaly Detector doesn't just tell you, "something's wrong." It correlates anomalies with specific operations across Warehouse, Spark, Power BI, Eventstream, Copilot, and more.
Each experience within Microsoft Fabric supports unique operations. An operation consumption rate is what converts the usage of the experience's raw metrics into Compute Units (CU). The Microsoft Fabric Capacity Metrics app's compute page provides an overview of your capacity's performance and lists Fabric operations that consume compute resources. Fabric operations.
The distinction between operation types matters here. Microsoft Fabric divides operations into two types, interactive and background. Interactive operations are on-demand requests and operations that can be triggered by user interactions with the UI, such as data model queries generated by report visuals. Background operations are longer running operations such as semantic model or dataflow refreshes. They can be triggered manually by a user, or automatically without user interaction. Fabric operations.
Understanding this classification helps you pinpoint whether anomalous CU spikes originate from user-triggered queries hitting a runaway report visual, or background processes like scheduled refreshes competing for resources.
Capacity admins received a notification such as "You're using X% of your available capacity", indicating that a Fabric capacity's utilization is high. They want to investigate which workloads or items (datasets, also known as semantic models; reports; pipelines; and so on) are contributing the most to this CU consumption, so they can consider optimizations (like query tuning or schedule changes) or capacity adjustments. Troubleshooting guide - Monitor and identify capacity usage.
The real transformation happens when you connect anomaly detection signals to your governance framework and automation workflows. This moves organizations from passive monitoring to active operational intelligence.
Fabric is designed to deliver fast performance to its customers. Bursting allows operations to temporarily use more compute than the provisioned compute for the capacity SKU. Because of bursting, users get results quickly without waiting. To avoid penalizing users when operations benefit from bursting, Fabric smooths, or averages, the CU usage of an operation over a longer timeframe. This behavior ensures users can enjoy consistently fast performance without experiencing throttling. Understand your Fabric capacity throttling.
But without anomaly detection, you can't distinguish between healthy bursting and problematic patterns that will eventually trigger throttling. Smoothing distributes consumed CU usage over future timepoints. Timepoints in Fabric are 30 seconds long. There are 2,880 timepoints in the next 24-hours. Interactive operations are smoothed over a minimum of five minutes, and up to 64 minutes depending on how much CU usage they consume. Background operations are smoothed over a 24-hour period because they typically have long runtimes and large CU consumption. Understand your Fabric capacity throttling.
The governance angle is equally critical. With the growing importance of data governance and security, Microsoft Fabric has introduced new features to help organizations maintain control over their data assets. These updates include enhanced access controls and auditing capabilities, providing administrators with better tools to manage data access and monitor usage. Microsoft Fabric Improves Data Engineering & Governance
Effective data governance in Microsoft Fabric depends on providing people with the correct information for their roles. Admins can see insights across the entire tenant, while individual data owners can only see insights for their own content. This shared responsibility model helps spread governance across the organization rather than keeping it locked in IT.Microsoft Fabric Governance Insights in OneLake.
Microsoft's Anomaly Detector represents a maturation of Fabric's monitoring philosophy. The platform is evolving from simply reporting what happened to actively identifying when something looks wrong, and connecting those signals to actionable items.
For Fabric admins and data engineers, this means:
Best practices: Monitor CU usage regularly to manage costs effectively and avoid unexpected charges. Use grouping and filtering options to optimize query efficiency.Anomaly detector capacity usage and billing in Real-Time Intelligence
The question for your organization isn't whether to adopt anomaly detection. It's how quickly you can integrate it into your capacity management and governance workflows. In a world where data platforms are expected to be self-managing and self-healing, proactive anomaly detection isn't a nice-to-have. It's the foundation of operational excellence.


Join Our Newsletter