What makes Fabric's implementation particularly powerful is its use of sophisticated multi-dimensional organization.
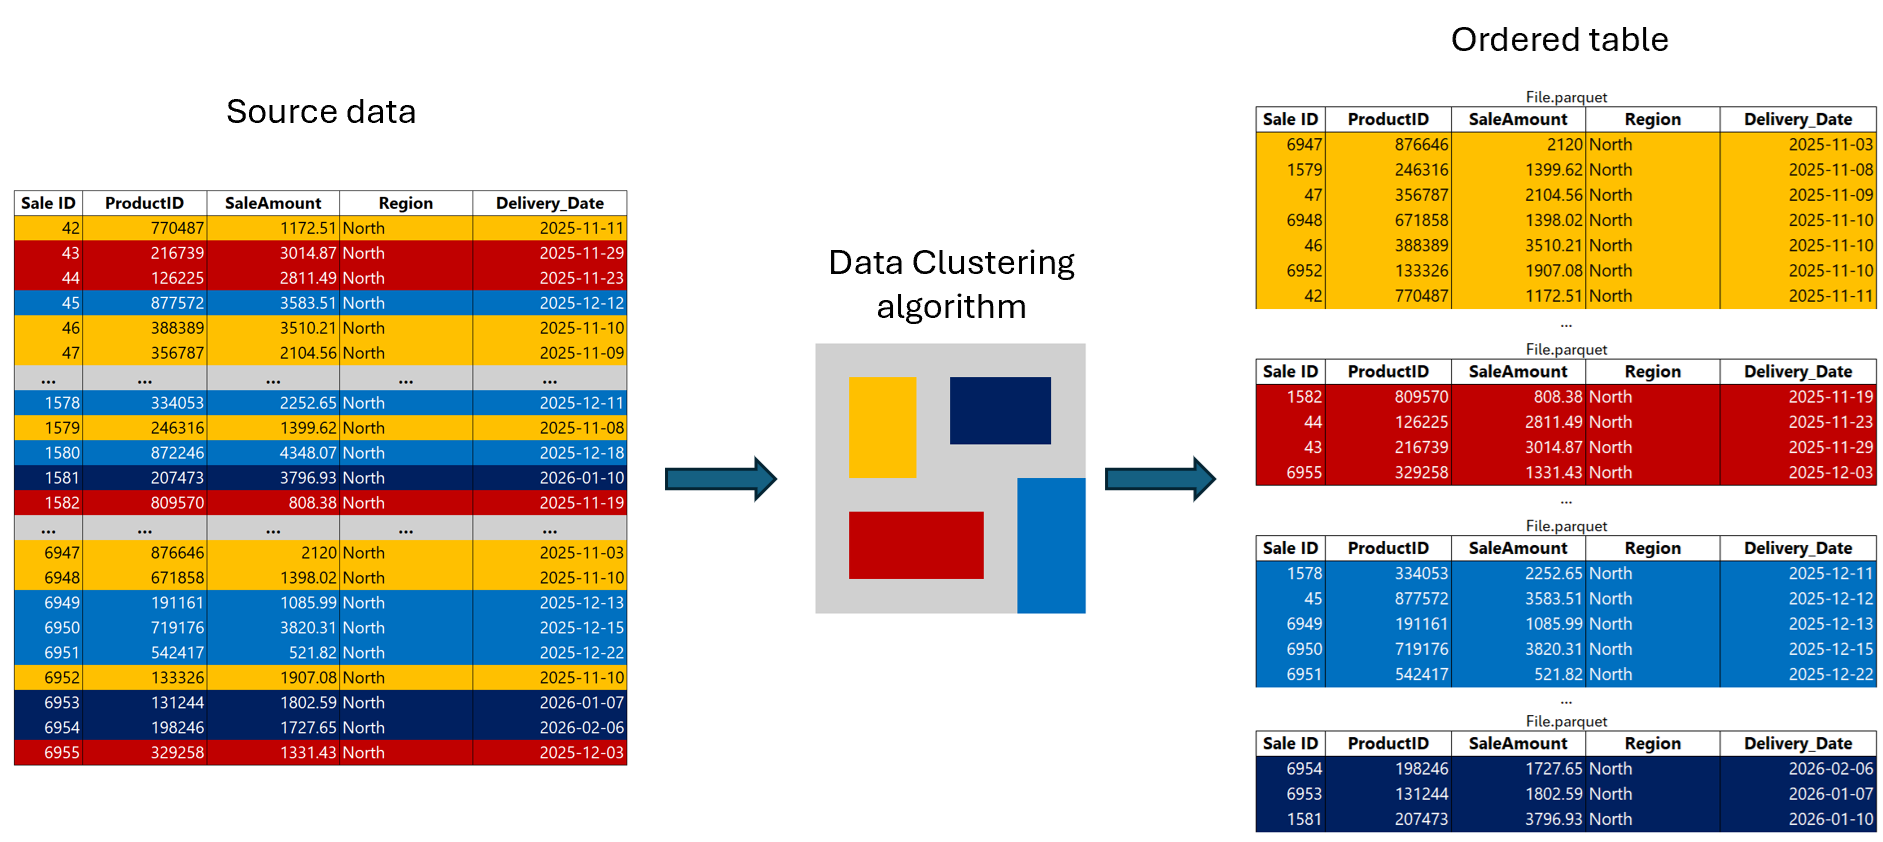
Data clustering uses a space-filling curve to organize data in a way that preserves locality across multiple dimensions, meaning rows with similar values across clustering columns are stored physically close together. This approach dramatically improves query performance by performing file skipping and reducing the number of files that are scanned.
Unlike conventional lexicographical ordering, data clustering uses a sophisticated algorithm to ingest, keeping rows with similar column values close together, even when a table is clustered by several columns. This distinction matters because traditional sorting methods lose effectiveness when you need to filter on multiple columns simultaneously.
This makes data clustering ideal for range queries, high-cardinality filters, and large tables with skewed distributions, resulting in faster reads, reduced I/O, and more efficient resource usage.
Data clustering metadata is embedded in the manifest during ingestion, allowing the warehouse engine to make intelligent decisions about which files to access during user queries. This metadata, combined with how rows with similar values are stored together ensures that queries with filter predicates can skip entire files and row groups that fall outside the predicate scope.
Larger tables benefit more from data clustering, as the benefits of file skipping scale with data volume.
Real-world testing has demonstrated significant performance improvements. A live demo comparing query times on regular versus clustered tables showed a performance boost from 45 seconds to under 2 seconds.
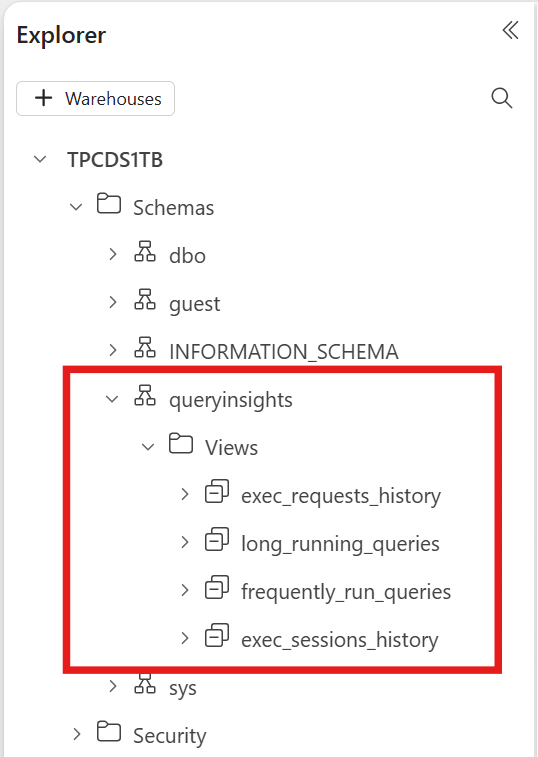
Not every table needs clustering. When deciding if data clustering could be beneficial, investigate query patterns and table characteristics in the warehouse. Data clustering is most effective when queries repeatedly filter on specific columns and when the underlying tables are large and contain mid-to-high cardinality data.
Repeated queries with WHERE filters: If the workload includes frequent queries filtering specific columns, data clustering ensures that only relevant files are scanned during read queries. This also applies when the filters are used repeatedly in dashboards, reports, or scheduled jobs and pushed down to the warehouse engine as SQL statements.
Data clustering delivers the most value for:
Skip clustering for small dimension tables, lookup tables with low row counts, or tables that are always fully scanned regardless of predicates. The overhead of maintaining clustering is not justified when file skipping opportunities are minimal.
Data Clustering introduces a new syntax option to the CREATE TABLE statement: CLUSTER BY.
When creating a new table, add the WITH (CLUSTER BY (column1, column2)) clause after your column definitions. For example, if you have a table with columns like ID, Name, Genre, Country, and DateFounded, you would specify the clustering columns (such as ID and DateFounded) in the CLUSTER BY clause.
During data ingestion, Data Clustering applies a sophisticated algorithm to arrange rows with similar values in adjacent storage locations.
For existing tables, use CREATE TABLE AS SELECT (CTAS) with the CLUSTER BY clause to create a clustered copy. Simply define your new table name, specify the clustering column in the WITH clause, and select all data from your original table. This creates an exact copy with clustering applied.
When multiple columns are used in Data Clustering (you can use up to four columns), our algorithm considers the value of all columns involved to determine how to store a particular row in storage, keeping rows with similar values close together.
Choose columns based on:
Clustering adds overhead during ingestion because the engine must reorganize data. For optimal clustering quality and cost efficiency, batch your DML operations. At least 1 million rows per batch is recommended to amortize the clustering overhead effectively.
Over time, compaction helps consolidate small files into optimally sized clustered segments, maintaining consistent query performance as your table grows.
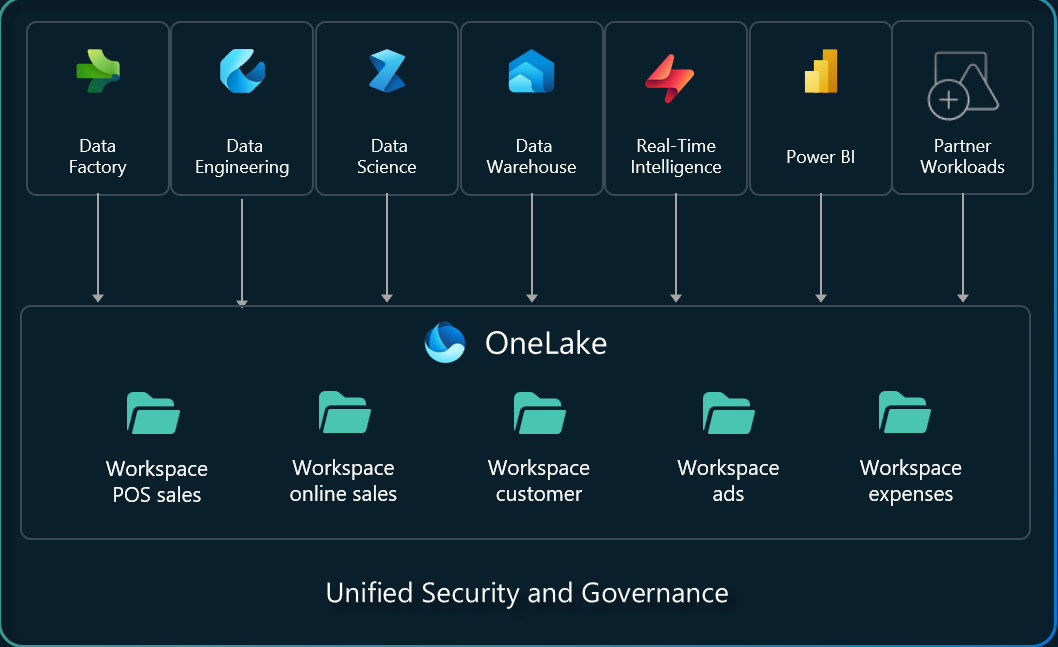
Delta Lake is the standard analytics table format in Fabric, and Delta tables produced by one engine (including Fabric Data Warehouse and Spark) can be consumed by other engines. Because clustering layout is reflected in the underlying Delta tables, Spark and other engines can also benefit from the same file skipping behavior. This makes your optimization investment portable across workloads.
Data clustering represents a significant opportunity to reduce query times and capacity unit consumption on your largest analytical tables. Start by:
For organizations migrating to Microsoft Fabric Data Warehouse, clustering should be part of your optimization strategy from day one. Define it at table creation time to maximize performance benefits as your data grows.


Join Our Newsletter