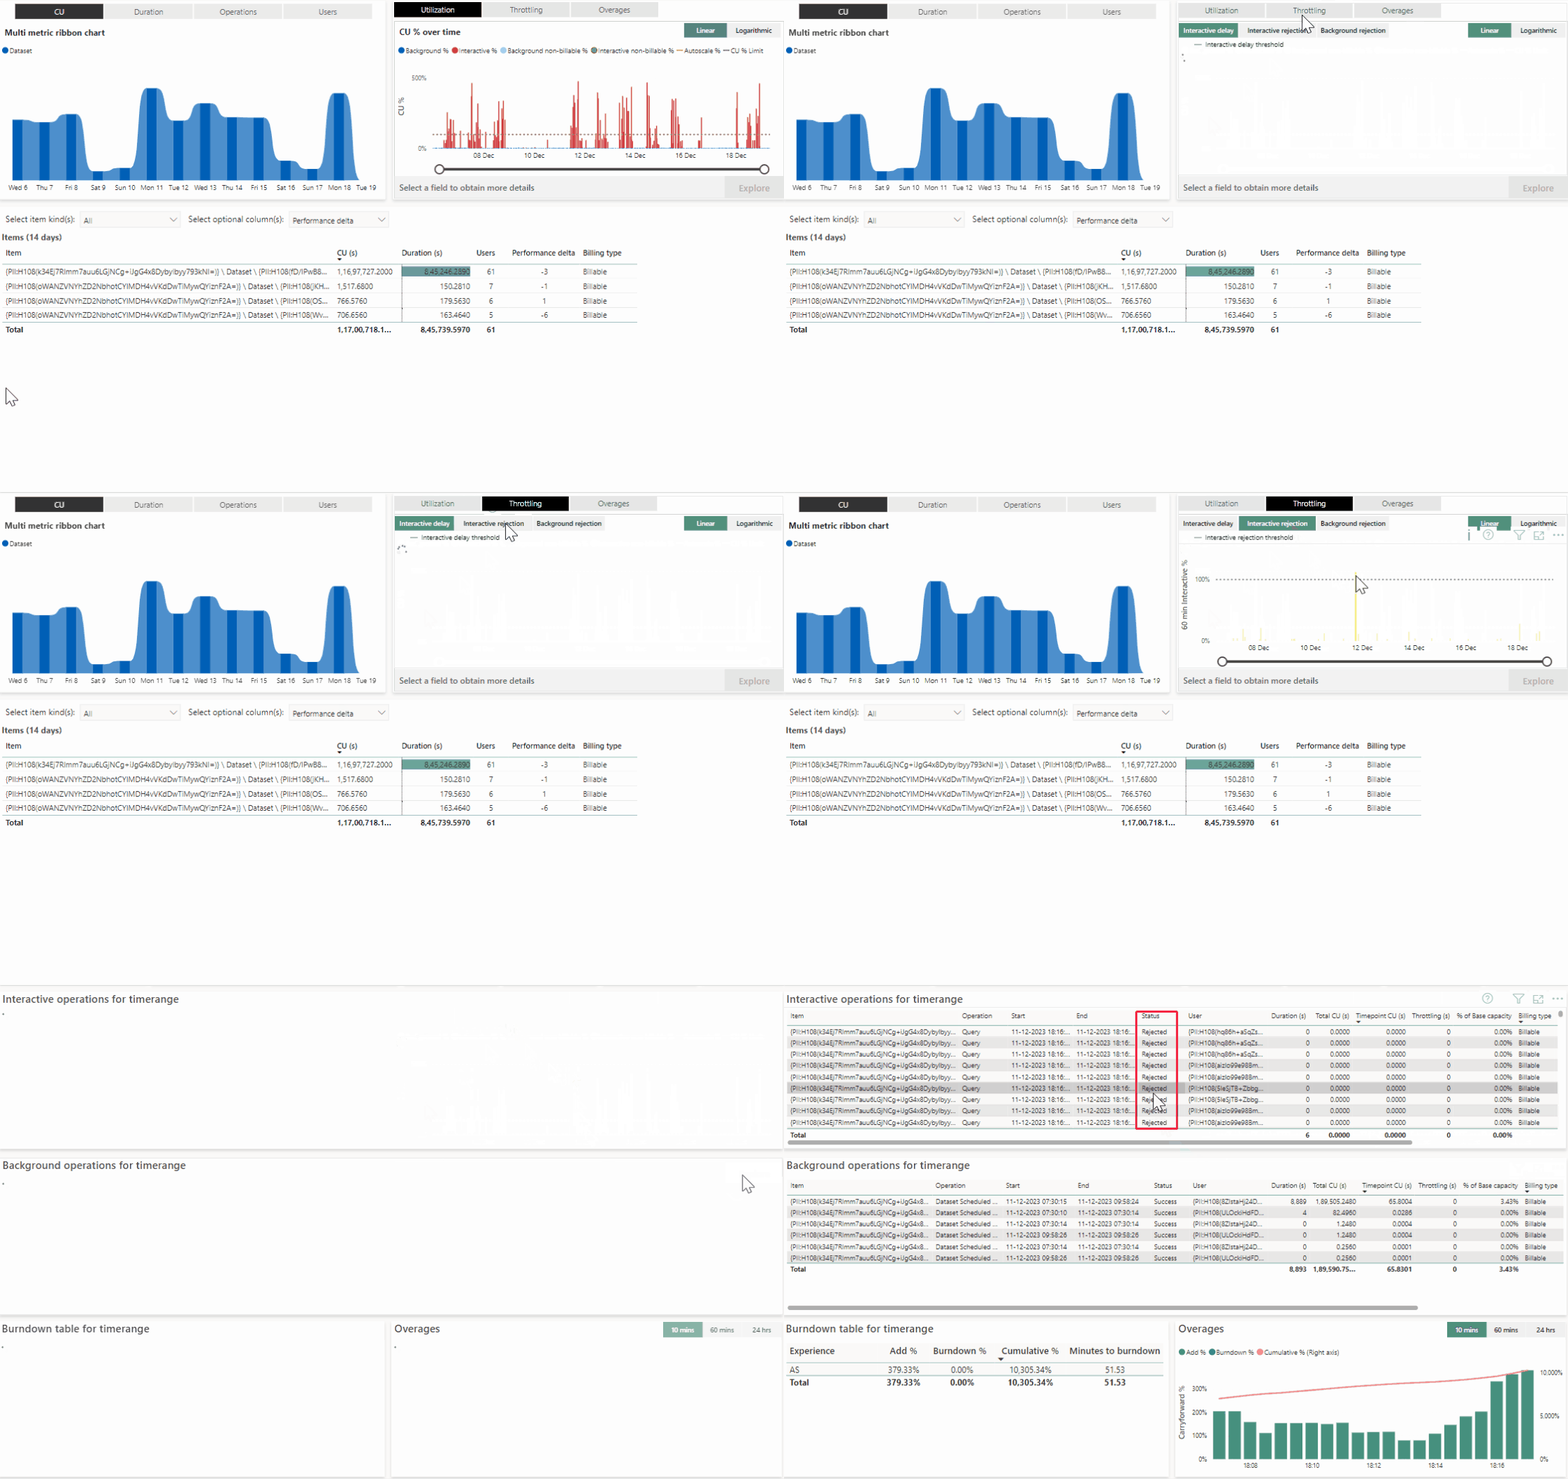
The Microsoft Fabric Item History page part of the Fabric Capacity Metrics App (Preview) gives you a 30-day snapshot of Fabric compute usage. It uses dynamic visuals and slicers to reveal both overall usage trends and detailed item-level metrics.

When you're managing compute capacity, visibility is key. The Microsoft Fabric Item History page surfaces both trends and anomalies in Fabric capacity monitoring, helping administrators and engineers act faster. Whether you're aiming for Fabric cost optimization or smoother operations, this tool converts raw usage data into actionable insights.
Explore aggregated compute data broken down by workspace and item, as well as a CU % over time chart. This shows how background operations (blue) and interactive operations (red) use capacity and flags when usage approaches overload thresholds.
Customize your view using filters for capacity name, workspace, experience, operation, user, and billing type (billable vs. non-billable). You can also select specific date ranges even narrowing down to hourly detail on single-day views.
Dive deeper with visuals that show operation status trends, scheduling frequency, compute and duration over time, and a breakdown of usage by item type, experience, or operation. Every view is interactive, letting you drill down into the details that matter.
Begin by opening the Fabric Capacity Metrics App and navigating to the Item History page. Explore your 30-day compute timeline spotting spikes or unusual patterns then use the built-in slicers to filter by workspace, item type, or user. Drill into specific days or items to identify the root causes. This helps with troubleshooting, scheduling tweaks, or proactive optimizations.


Remember, this feature is in preview, so its layout, filters, and capabilities may evolve Microsoft Learn. For now, it’s best used alongside your existing monitoring and cost management tools.
The Microsoft Fabric Item History page provides clear, actionable insight into Fabric compute usage across a rolling 30-day period. It's an essential tool for troubleshooting, tracking capacity trends, and supporting Fabric cost optimization. If you're managing Fabric at scale, it's definitely worth exploring within the Fabric Capacity Metrics App (Preview).
Join Our Newsletter