The world of work is changing fast. More and more companies are using artificial intelligence to help with everyday tasks. But using AI is more than just flipping a switch; organizations need precise data about how and when AI tools are used. That is precisely why the new Microsoft 365 Copilot Dashboard update is such a big deal. With the new Agent Dashboard and stronger Copilot Analytics, businesses finally have tools that show how AI is adopted, used, and creating value across teams. Invisible numbers in the background now become clear reports and easy-to-read charts.
Until recently, many companies struggled to measure just how much their AI tools, like Copilot Chat, agents, and Copilot itself, were being used. Leaders couldn’t easily see who was using them, how often, or if those tools were actually making work easier. The latest update changes that. By offering centralized, transparent reporting, Microsoft helps teams and enterprises drive real impact, not just install features.
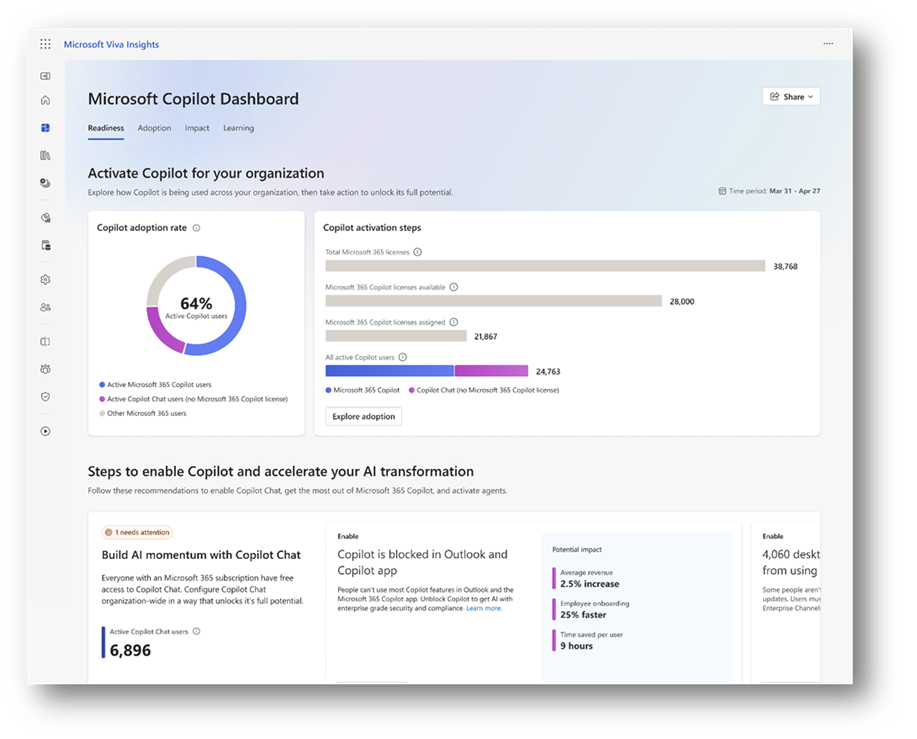
At the heart of this update is the unified Copilot Dashboard, combining usage data from multiple sources. Whether someone is using Copilot Chat in a browser or working with AI agents built via Copilot Studio, this dashboard logs their activity. That means business leaders and IT managers can view everything in one place, without having to jump between separate tools and reports. The dashboard now supports adoption metrics for both Copilot and Copilot Chat.

With Copilot Chat reporting, organizations can instantly see which apps (like Word, Excel, Teams) or surfaces employees are using, how often, and whether usage is increasing over time. This helps reveal where Copilot is being most helpful, and where additional training or rollout might be needed.
Moreover, the dashboard lets you track retention (how often people come back), weekly and monthly trends, and compare adoption across different groups or departments. That kind of insight helps companies spot early signs of success or areas that need more support.
One of the most powerful new features is Copilot Benchmarks. This lets organizations not only see their own usage but also compare it with that of peer companies. It’s like having a scoreboard: you can see if you’re among the early adopters of AI tools, or still catching up.
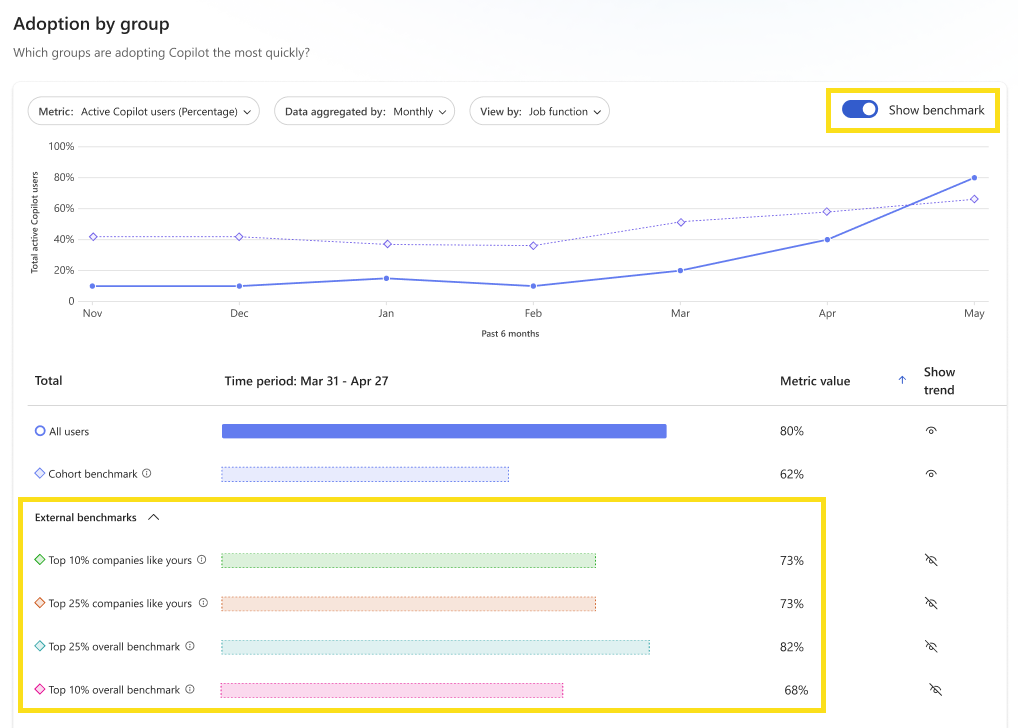
Benchmarks are shown in aggregate; no private user data is exposed. Instead, what matters are trends across groups: how many are active, which apps are used most, and how many users return frequently. With side-by-side internal comparisons and external benchmarking against peer companies (top 10%, top 25%, etc.), this gives leadership an honest view of where their AI adoption stands and where to push next.
For leaders and managers, benchmarking is key. It helps them set realistic goals, understand what “good adoption” looks like, and plan for improved rollout.
AI in the workplace isn’t just about chat. Many companies build or deploy specialized agents, small AI tools customized for specific tasks: summarizing documents, handling HR questions, pulling data from company databases, or automating workflows. With the new Agent Dashboard, organizations can see precisely how these agents are being used.
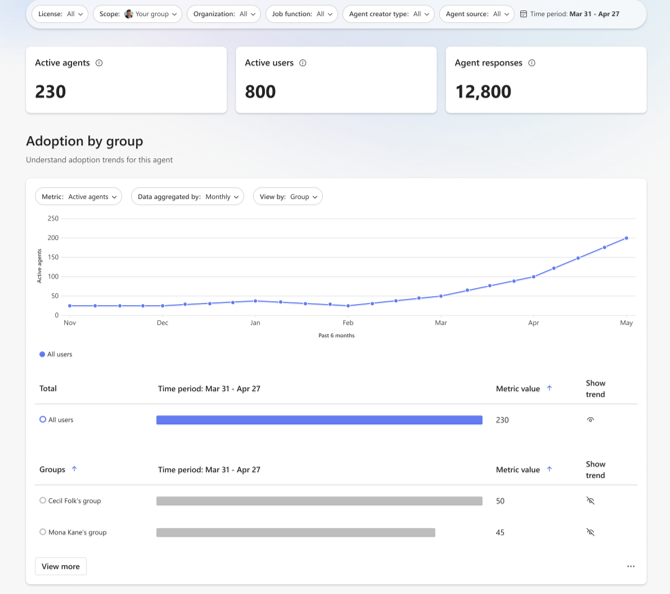
From the Agent Dashboard, admins and analysts can monitor key metrics: the number of active agents, the number of users who interact with them, the number of responses agents have given, user engagement and retention, and how often agents are shared. That means you can identify which agents deliver real value and which are rarely used, helping you focus resources where they matter most.
The dashboard also highlights top-performing agents. That helps leaders understand what tools are resonating with people. One agent could summarize shared documents to save time. If that agent shows high usage and good retention, it’s a clear win. Meanwhile, underperforming agents can be tweaked or retired.
Right now, the initial release supports agents built under Microsoft 365 Copilot. But plans are to expand support to other kinds of agents and add more metrics over time.
Having data is only half the battle. The update also provides IT teams with customized guidance to make AI adoption smoother. On the revamped Readiness page in the Copilot Dashboard, IT leaders receive tailored recommendations to improve Copilot, Copilot Chat, and agent usage. That might include adjusting configuration settings, rolling out training to particular groups, or encouraging adoption where it’s low.
But what if your organization likes to do custom analysis? No problem. The new update lets you export Copilot Dashboard data into a CSV file. With that, you can plug data into spreadsheets, build custom reports, or merge with internal business data. That gives flexibility to track AI adoption against business performance or ROI.
For even more advanced users, there’s another powerful tool: Copilot Analytics in Graph API. Analysts can tap into the same rich data available in the dashboard, user counts, app usage, and last activity dates, and integrate it with internal tools or dashboards. This makes it easier for IT and analysts to build custom data pipelines, reports, or dashboards for management.
Overall, the new Centralized Agent Dashboard and Enhanced Reporting update transforms AI adoption from a guessing game to a data-driven process. Companies are no longer relying on feeling or anecdotal feedback to understand Copilot usage. Instead, they have visibility, context, and real numbers.
This matters because, as more businesses embrace AI tools, the risk of underuse or misuse grows, and without metrics, it’s hard to know if AI is genuinely helping. With these dashboards and analytics, companies can measure value, identify success stories, and scale up what works.
It also helps with planning. Teams can spot groups that haven’t adopted Copilot yet, determine which agents are effective, and plan licensing or training accordingly. Administrators can pull reports, export data, and analyze trends supporting better decisions about AI deployment, budgeting, and future planning.
This update isn’t a one-time change. According to the plans, support for additional agent types and metrics will be added over time.
What that means for organizations is continuous improvement: as Microsoft expands support, dashboards will become even more comprehensive. That will likely help teams measure more aspects of AI usage, track long-term trends, and correlate AI adoption with business performance.
For companies willing to invest, this creates a strong foundation for long-term, sustainable AI integration not just through experimentation, but through informed, data-guided growth.
The latest update to the Microsoft 365 Copilot Dashboard, including the Agent Dashboard, Copilot Analytics, Copilot Benchmarks, export tools, Readiness reporting, and the Graph API, provides companies with powerful, flexible, and precise tools to measure their AI usage and impact. Rather than vague guesses about who uses what, organizations now get data, metrics, and stories. Instead of manual tracking or scattered logs, they get unified dashboards.
For businesses ready to scale AI and make it part of everyday work, this update transforms AI adoption from a tech experiment into a measurable, manageable, and strategic investment.
Using these tools, IT teams, analysts, and leaders can see what works, improve what doesn’t, and confidently steer their organization toward smarter, data-driven AI integration.


Join Our Newsletter