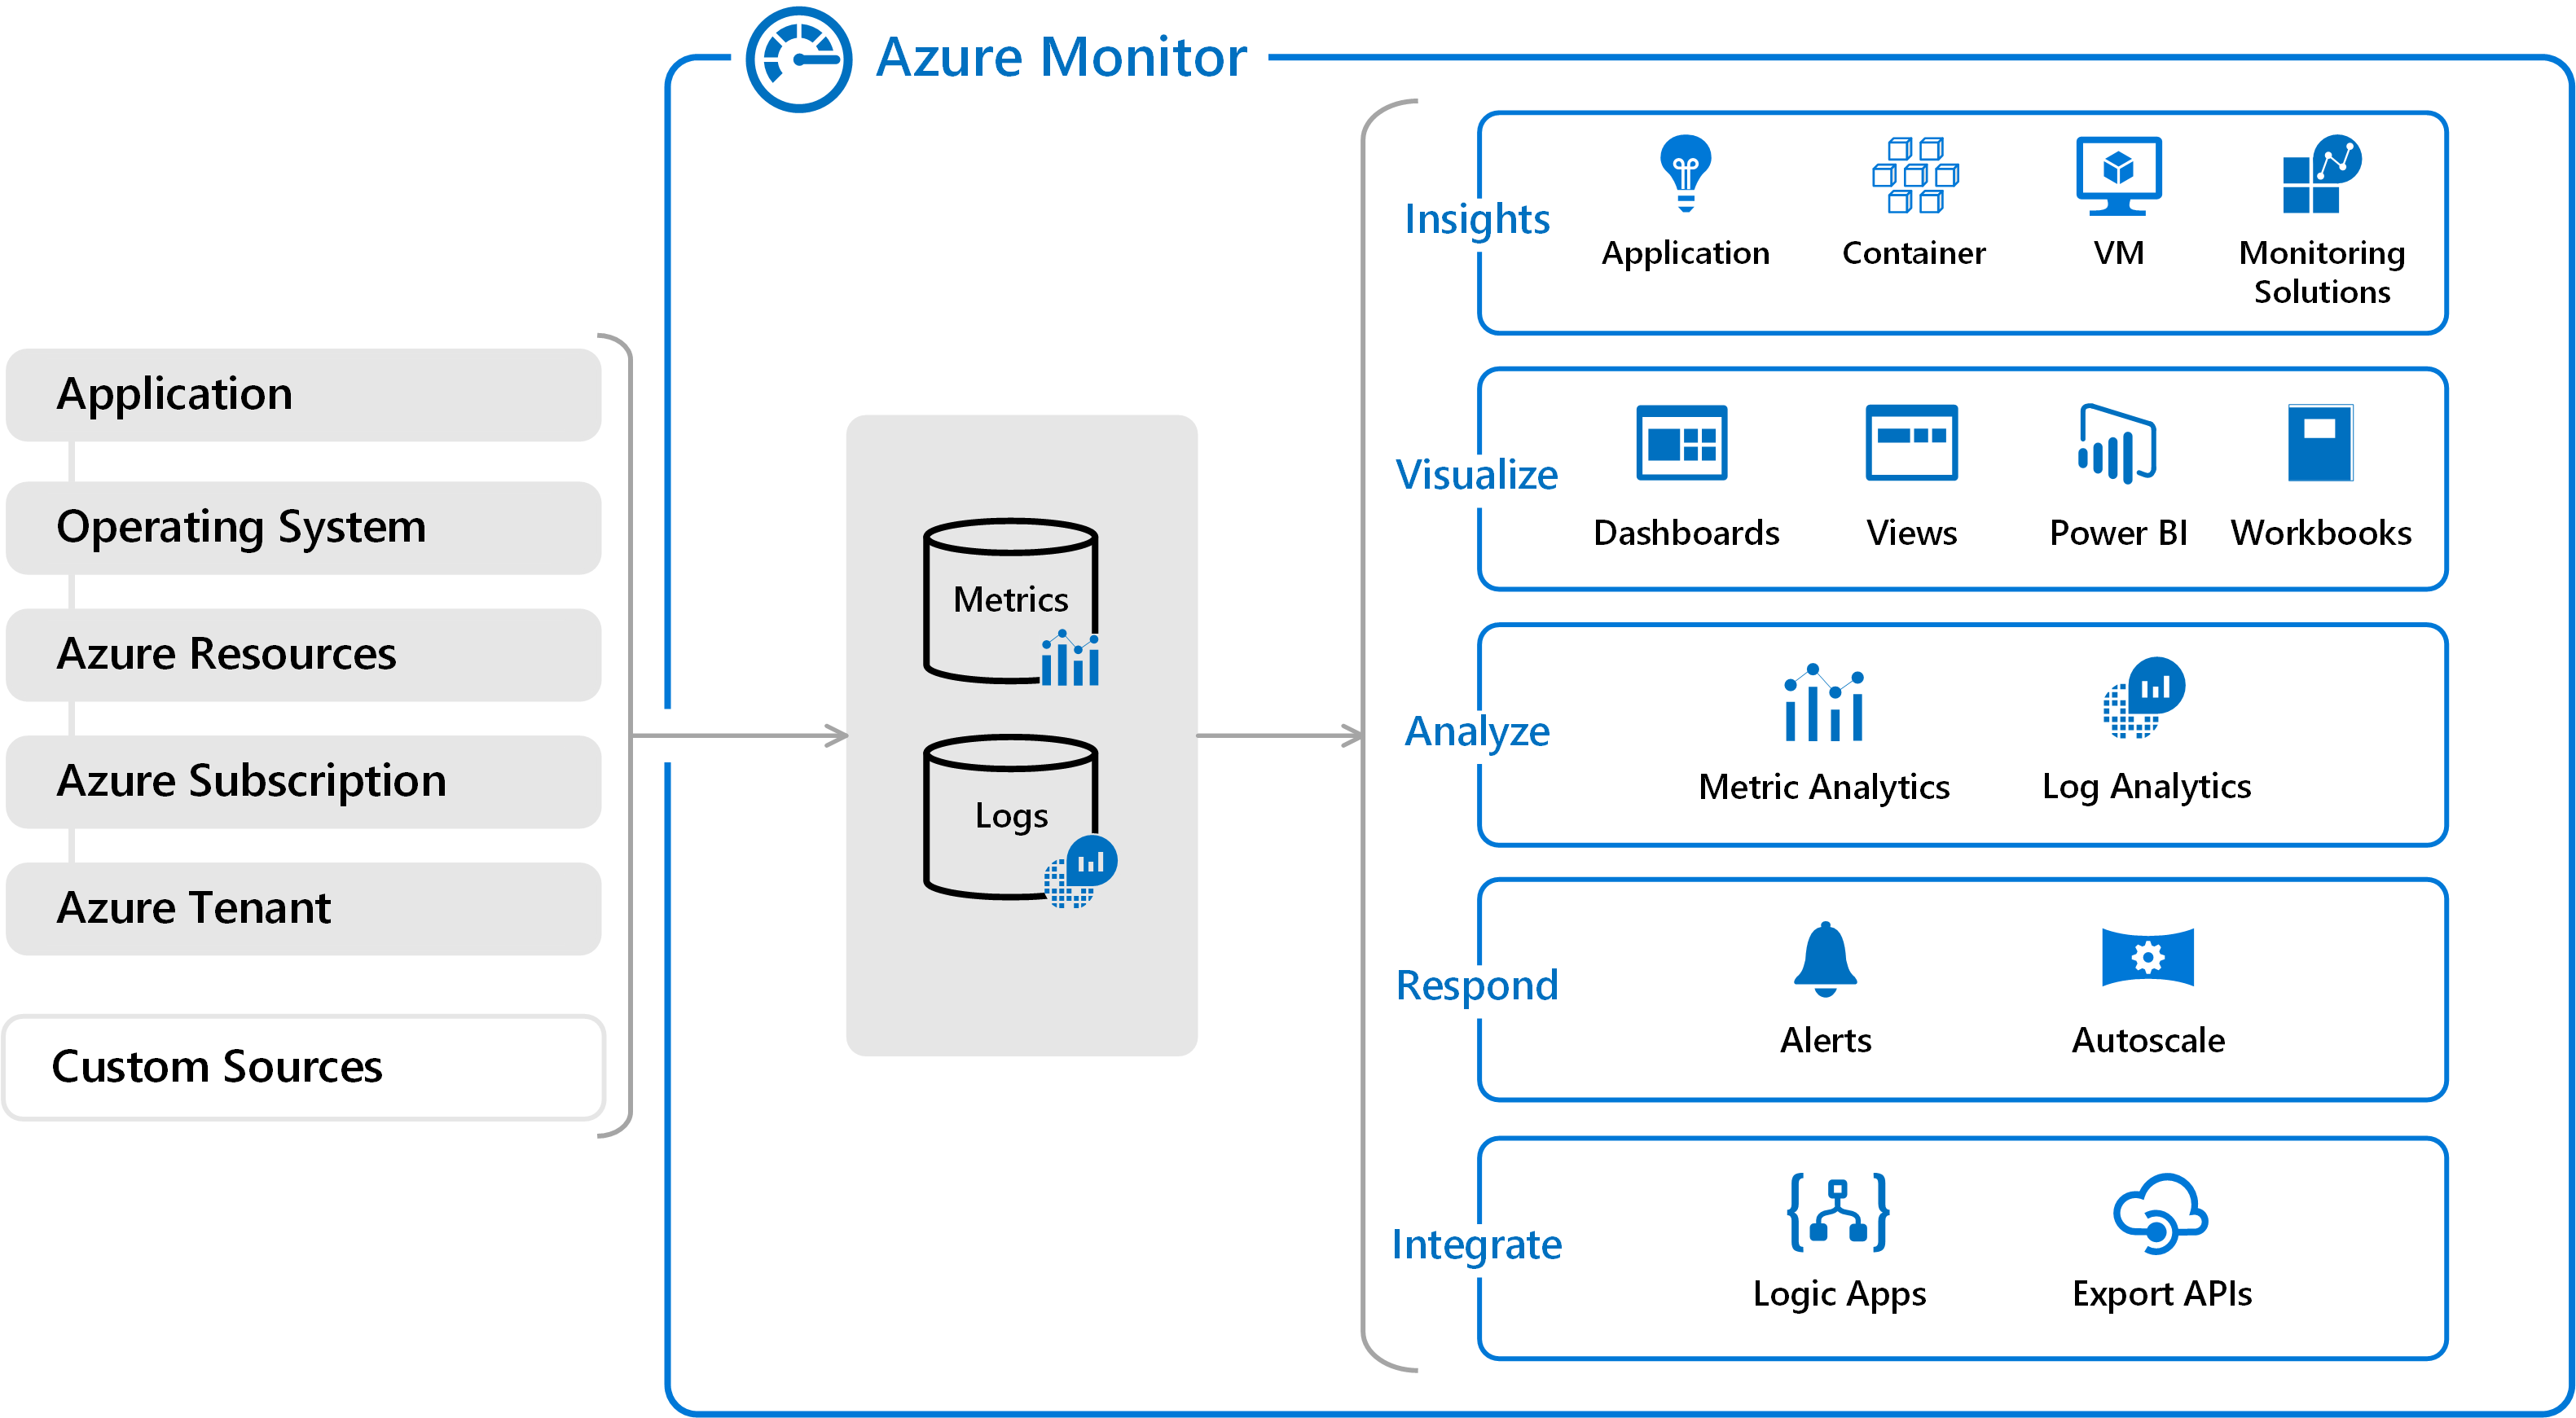
Modern AI systems often utilize multiple agents working together to plan, call tools, and pass tasks among each other. When something goes wrong, it’s challenging to pinpoint where the problem originated. That’s why Azure AI Foundry observability is a big deal: it gives teams one clear view of what every agent did, every tool call, and every decision made. Microsoft recently extended OpenTelemetry with agent-aware conventions, allowing traces to map cleanly across agents and tools.
The core change that Microsoft and its partners introduced is the addition of new, standard spans and attributes in OpenTelemetry that describe agent behavior. Instead of a plain trace of events, traces now include agent-specific spans, such as execute_task, invoke_agent, and execute_tool. These tell you who planned a task, which agent called which tool, and what the tool returned. That structure enables the tracking of a single user request as it passes through multiple agents and tools.
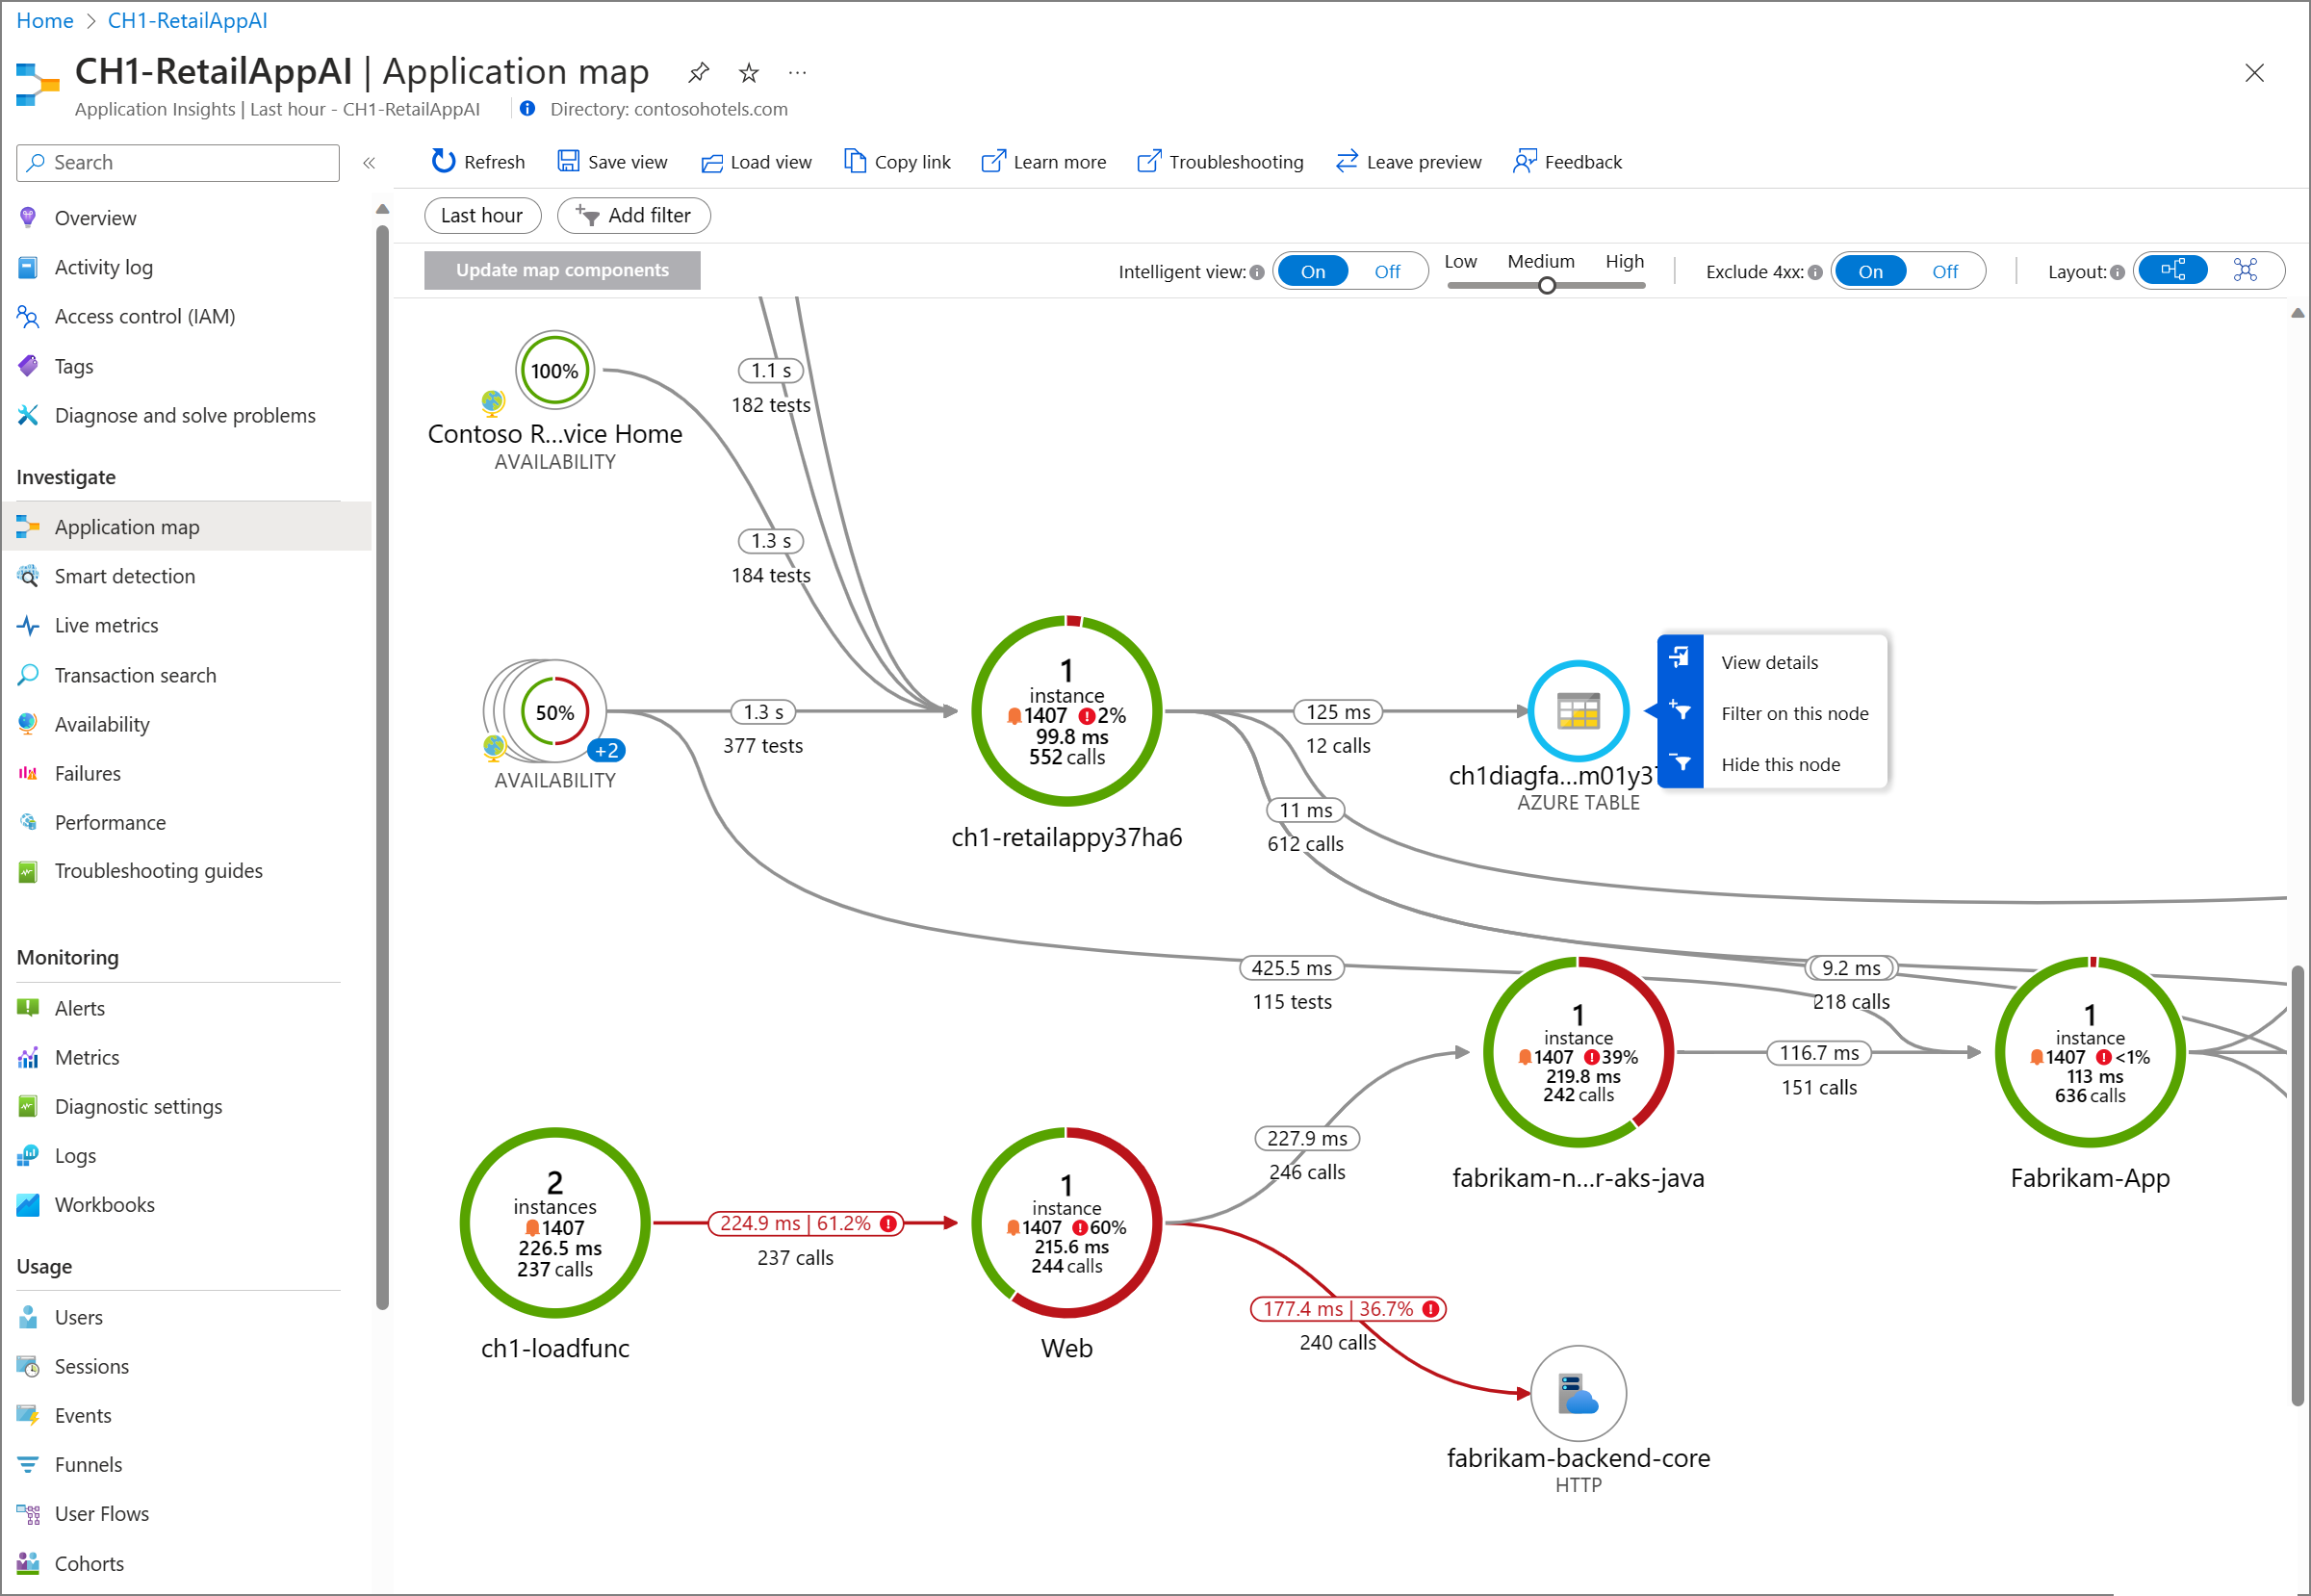
Azure AI Foundry acts like a central hub. It instruments agents, regardless of whether you build them in Foundry, LangChain, LangGraph, or the OpenAI Agents SDK, so that traces use the same language. That means a trace started in one framework can be understood and visualized alongside traces from another. Foundry ties traces to evaluation events, so you can not only see what happened, but also how the outcome was scored (success, error type, label). This helps with governance and audits because decisions are auditable and linked to identity and tooling.

When agent traces are unified, practical wins follow: you can fix problems faster because you can trace an error back to the exact agent or tool call that caused it instead of chasing logs across systems; safety and audits improve since evaluation events let you measure whether an agent’s decision matched policy or a safety check, which is crucial for compliance; and you can cut waste because traces reveal token usage, tool calls, and latency, allowing you to spot inefficient flows and reduce costs.
These are not theoretical benefits; they’re what Foundry’s observability features aim to deliver for production agent systems.
If you want to take advantage of these capabilities, here’s a clear path:

As systems grow more agentic, observability will shift from “nice to have” to “must have.” Expect richer evaluation metrics, better visualization tools that show branching agent conversations, and more automated anomaly detection tied to agent behavior. With Microsoft’s OpenTelemetry extensions and Azure AI Foundry’s observability features, teams can build complex, multi-agent solutions while still keeping control and visibility. This helps move AI from prototypes to reliable production services.
If you’re building agent systems, start with the Foundry docs and the tracing how-to. Instrument one agent first, get traces flowing into Azure Monitor, and then add evaluations and dashboards. That stepwise approach transforms opaque agent behavior into clear, auditable workflows, enabling your team to iterate with confidence.


Join Our Newsletter